Power BI中插入动态SVG图像
在上一篇文章[[Power BI新式卡片图性能与美观兼得]]中有介绍新卡片图中可以插入动态的SVG图片,从而丰富卡片图的内容,但其实SVG不止可以插入到新卡片图中。比如最常用的SVG地图,还可以加入到表格或者矩阵中。比如下面这样
SVG作为一种轻量化的图形,很多时候效果比第三方图表插件要好的多。
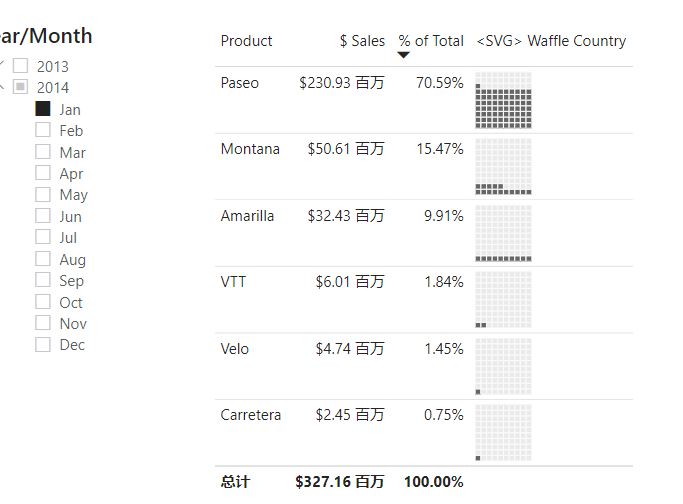
华夫饼图
华夫饼图可以用来显示完成的进度。有一个个小单元格网格组成,其中彩色单元格代表数据。所以,如果要用SVG实现,就得先构造小单元风格。
SVG:可缩放矢量图形 | MDN (mozilla.org)
<svg viewBox="0 0 10 10" xmlns="http://www.w3.org/2000/svg">
  <rect width="10" height="10">
    <animate
      attributeName="rx"
      values="0;5;0"
      dur="10s"
      repeatCount="indefinite" />
  </rect>
</svg>
之后就可以构造SVG了,下面的代码很长,主要是在构造网格,使用时,只需要修改要显示的度量和颜色部分就可以,其他部分可以不做修改
<SVG> Waffle Country =
VAR __svgPadding = 2
VAR __gridX = 10
VAR __gridY = 10
VAR __gridInterval = 1
VAR __gridTotal = __gridX * __gridY
VAR __gridTable = ADDCOLUMNS(
GENERATESERIES(
0,
__gridTotal - 1,
__gridInterval
),
"@Inverse", __gridTotal - [Value] - 1
)
VAR __gridCoords = ADDCOLUMNS(
__gridTable,
"@X", MOD ( [Value], __gridX ),
"@Y", FLOOR( [@Inverse] / __gridX, 1)
)
//需要修改的部分
VAR __fillEmpty = "#eaeaea"
VAR __fillIncluded = "#666"
VAR __percentage = [% Product Sales of Total] * 100
VAR __percentageSort = FORMAT(__percentage, "000.00")
VAR __svgBase =
"data:image/svg+xml;utf8,
<svg
sort='" & __percentageSort & "'
xmlns='http://www.w3.org/2000/svg'
width='100%'
height='100%'
viewBox='0 0 " & __gridX & " " & __gridY & "'
preserveAspectRatio='none'
>
{waffle}
</svg>"
VAR __waffles = CONCATENATEX(
__gridCoords,
"<rect
value='" & [Value] & "'
height='1'
width='1'
x='" & [@X] & "'
y='" & [@Y] & "'
stroke='#fafafa'
stroke-width='2%'
fill='" &
IF(
ROUND(__percentage, 0 ) > [Value],
__fillIncluded,
__fillEmpty
) &
"'>
<animate
attributeName='width'
from='0'
to='1'
dur='0.5s'
/>
<animate
attributeName='height'
from='0'
to='1'
dur='1.5s'
/>
</rect>", "", [Value], ASC
)
RETURN
IF(
HASONEVALUE( Product[Product] ),
SUBSTITUTE(
__svgBase,
"{waffle}",
__waffles
),
BLANK()
)
外部工具制作SVG
上面的代码已经可以做为模板来使用了,我们可以保存在自己的代码库中,供使用的时候调取,有些人可能会觉得还不够方便,当然,也是可以通过外部工具来保管代码库和快速创建度量。这里使用的是企业DNA开发的Quick Measure Pro,该工具需要购买网站的高级会员才能下载,版权原因就不分享了,不过该网站经常有比赛,参加比赛获奖了就能得到高级会员资格。下面以新卡片图中添加迷你图为例,全程只需要动动鼠标,不需要写一行代码。
Year SVG Sparklines Measure =
// Static line color - use %23 instead of # for Firefox compatibility
VAR LineColor = "%2301B8AA"
// "Date" field used in this example along the X axis
VAR XMinDate = MIN('Date'[Date])
VAR XMaxDate = MAX('Date'[Date])
// Obtain overall min and overall max measure values when evaluated for each date
VAR YMinValue = MINX(VALUES('Date'[Date]),CALCULATE(('Financials'[$ Sales])))
VAR YMaxValue = MAXX(VALUES('Date'[Date]),CALCULATE(('Financials'[$ Sales])))
// Build table of X & Y coordinates and fit to 100 x 100 viewbox
VAR SparklineTable = ADDCOLUMNS(
SUMMARIZE('Date','Date'[Date]),
"X",INT(100 * DIVIDE('Date'[Date] - XMinDate, XMaxDate - XMinDate)),
"Y",INT(100 * DIVIDE(('Financials'[$ Sales]) - YMinValue,YMaxValue - YMinValue)))
// Concatenate X & Y coordinates to build the sparkline
VAR Lines = CONCATENATEX(SparklineTable,[X] & "," & 100-[Y]," ", [Date])
// Add to SVG, and verify Data Category is set to Image URL for this measure
VAR SVGImageURL = IF(HASONEVALUE('Date'[Year]),
"data:image/svg+xml;utf8," &
"<svg xmlns='http://www.w3.org/2000/svg' x='0px' y='0px' viewBox='0 0 100 100'>" &
"<polyline fill='none' stroke='" & LineColor &
"' stroke-width='3' points='" & Lines &
"'/></svg>",
BLANK())
RETURN
SVGImageURL效果如下
总结
SVG的效果很多时候只是为了锦上添花,建模人员还是要花更多的时候在模型优化上,确实必须使用SVG来实现效果时,可求助web前端人员的帮助,毕竟SVG效果中,只是使用DAX变量来代替图表数据部分,其他部分是固定的,专业的事情还是找专业的人帮忙速度更快些。
相关链接
Introduction – SVG: Scalable Vector Graphics | MDN (mozilla.org)
Chart Templates – EXPLORATIONS IN DATA STORYTELLING WITH POWER BI (kerrykolosko.com)
Adding A Power BI SVG Visual On Your Report (enterprisedna.co)
Power BI – 5 Stars SVG – Hat Full of Data — Power BI – 5 星 SVG – 充满数据的帽子
Matrix Revolutions: Putting the “Whoa” into PBI Matrix with dynamic SVG – Daniel Marsh-Patrick – YouTube — 矩阵革命:使用动态 SVG 将“哇”放入 PBI 矩阵 – Daniel Marsh-Patrick – YouTube